

Vitest UI
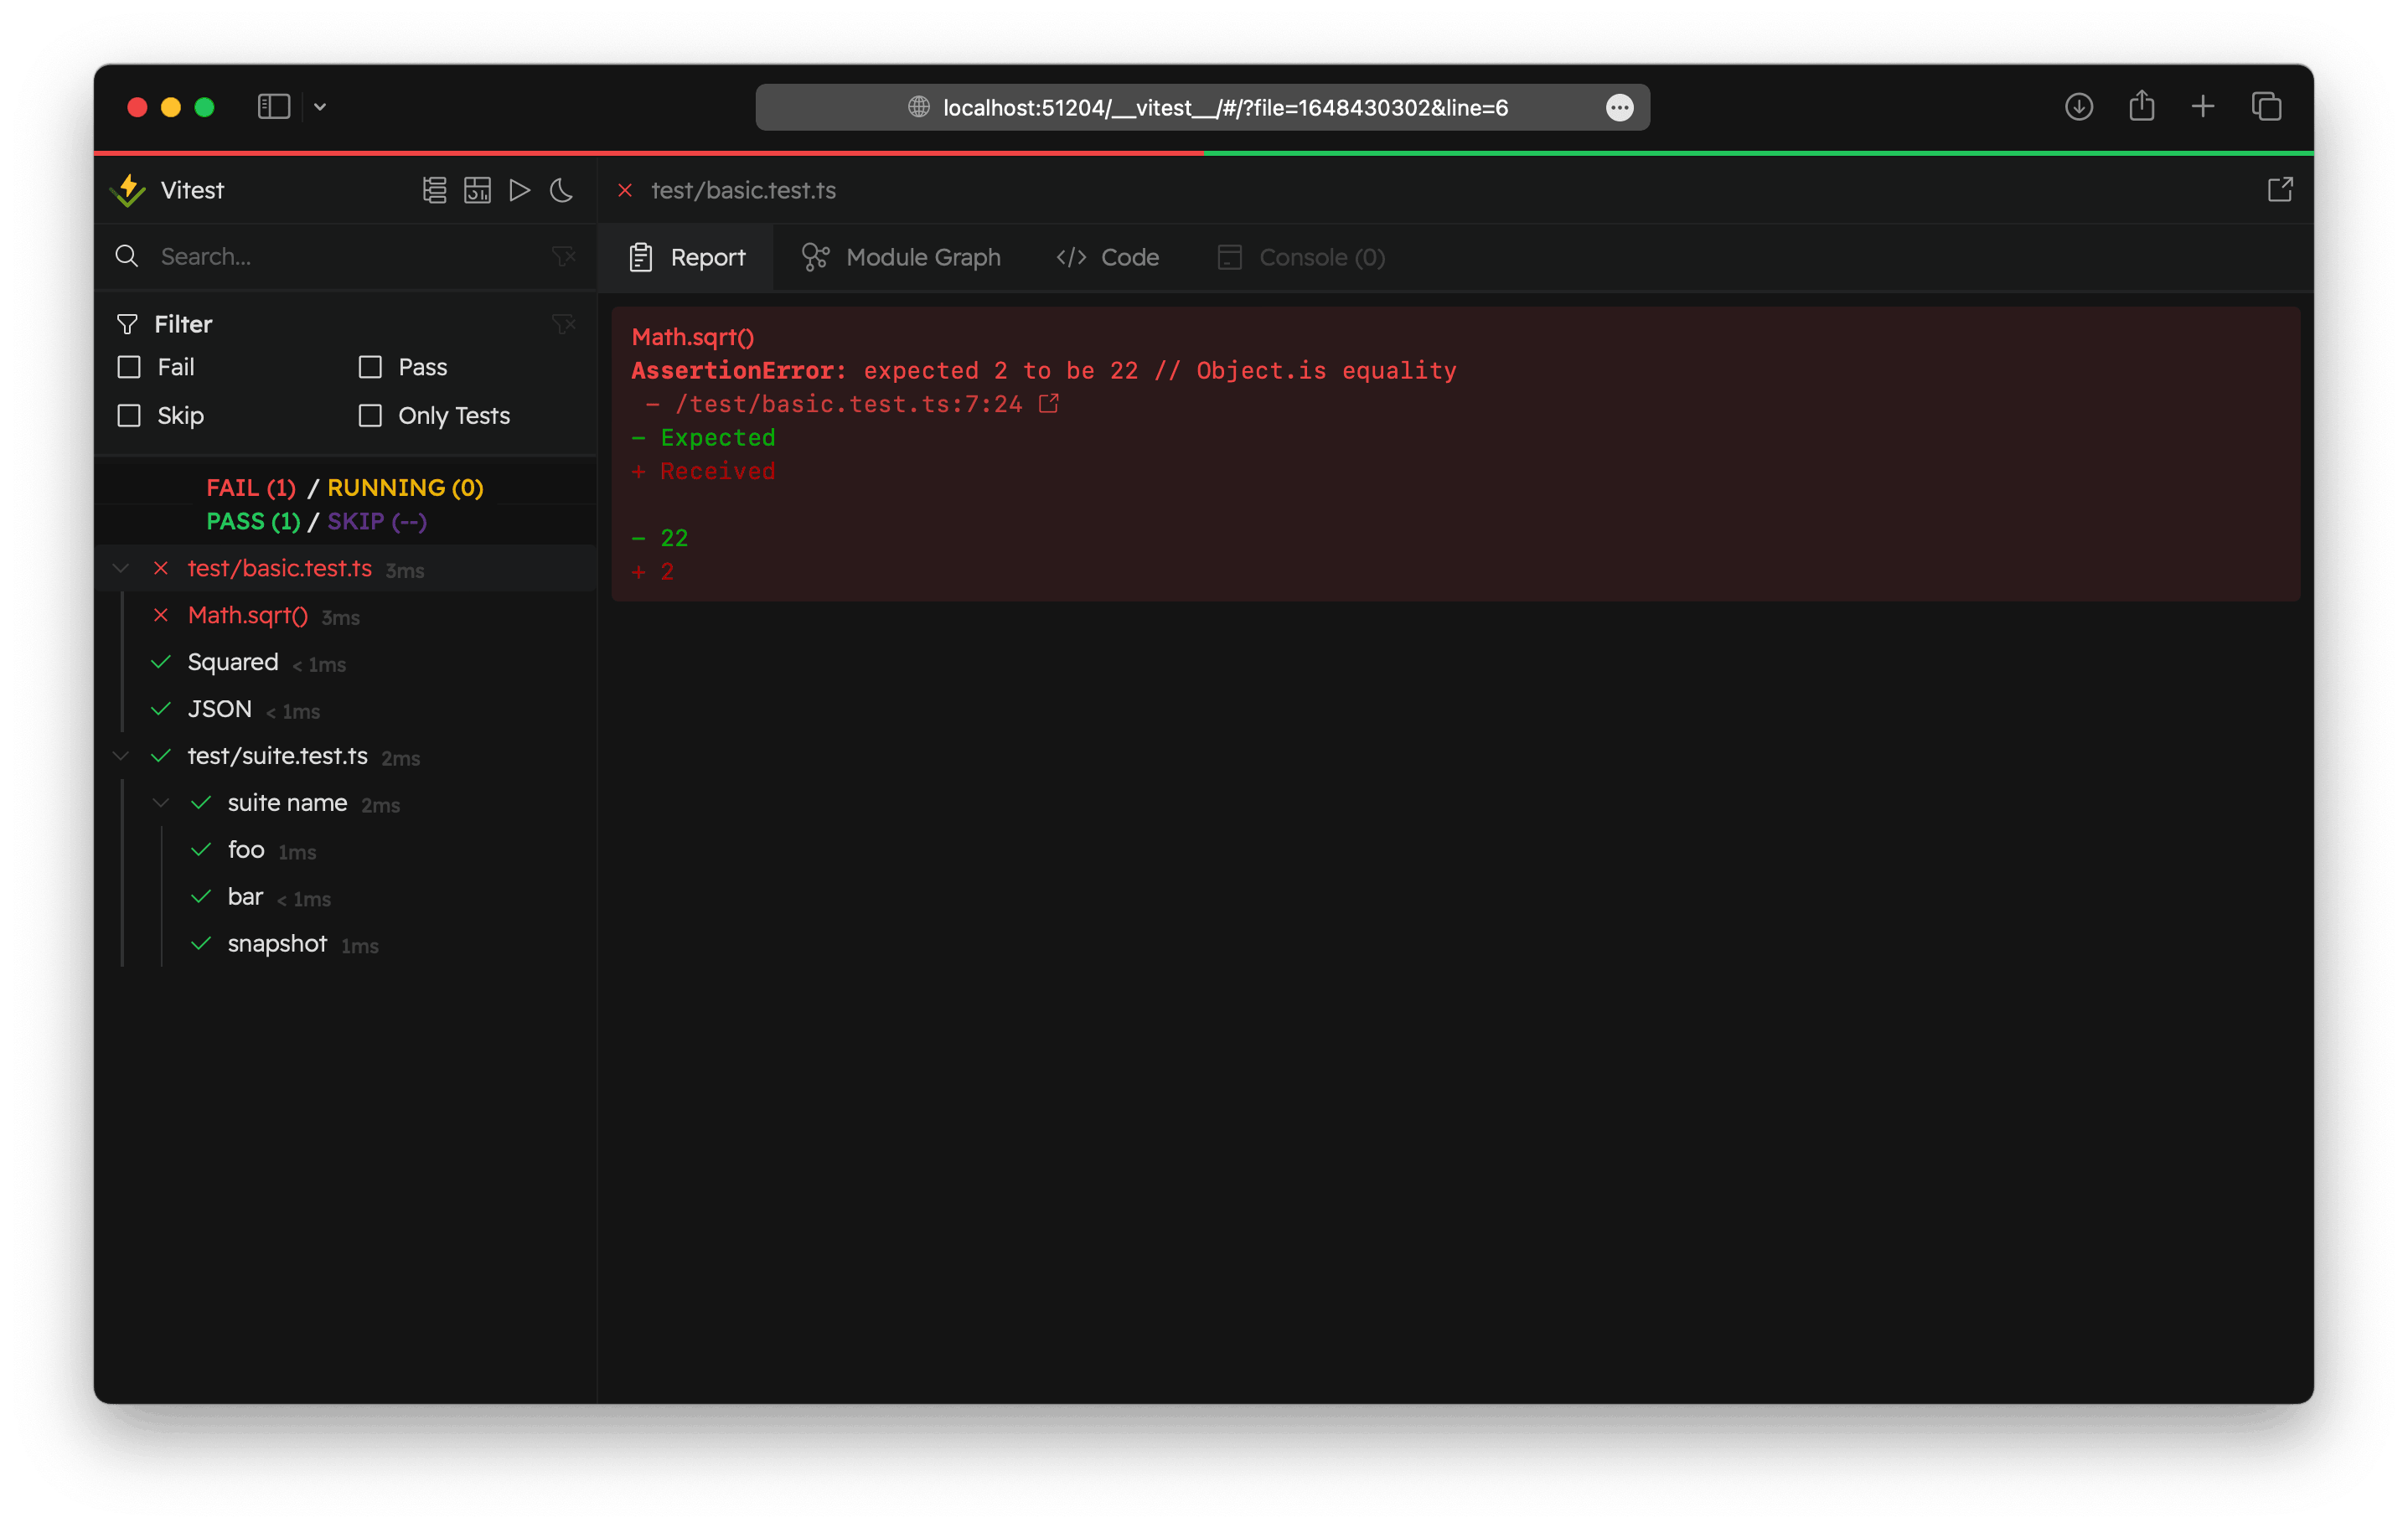
Vitest UI is a visual interface for exploring your test results. You can use it interactively while tests run or as a static HTML report for reviewing completed runs.
Vitest UI is optional, so you'll need to install it with:
npm i -D @vitest/ui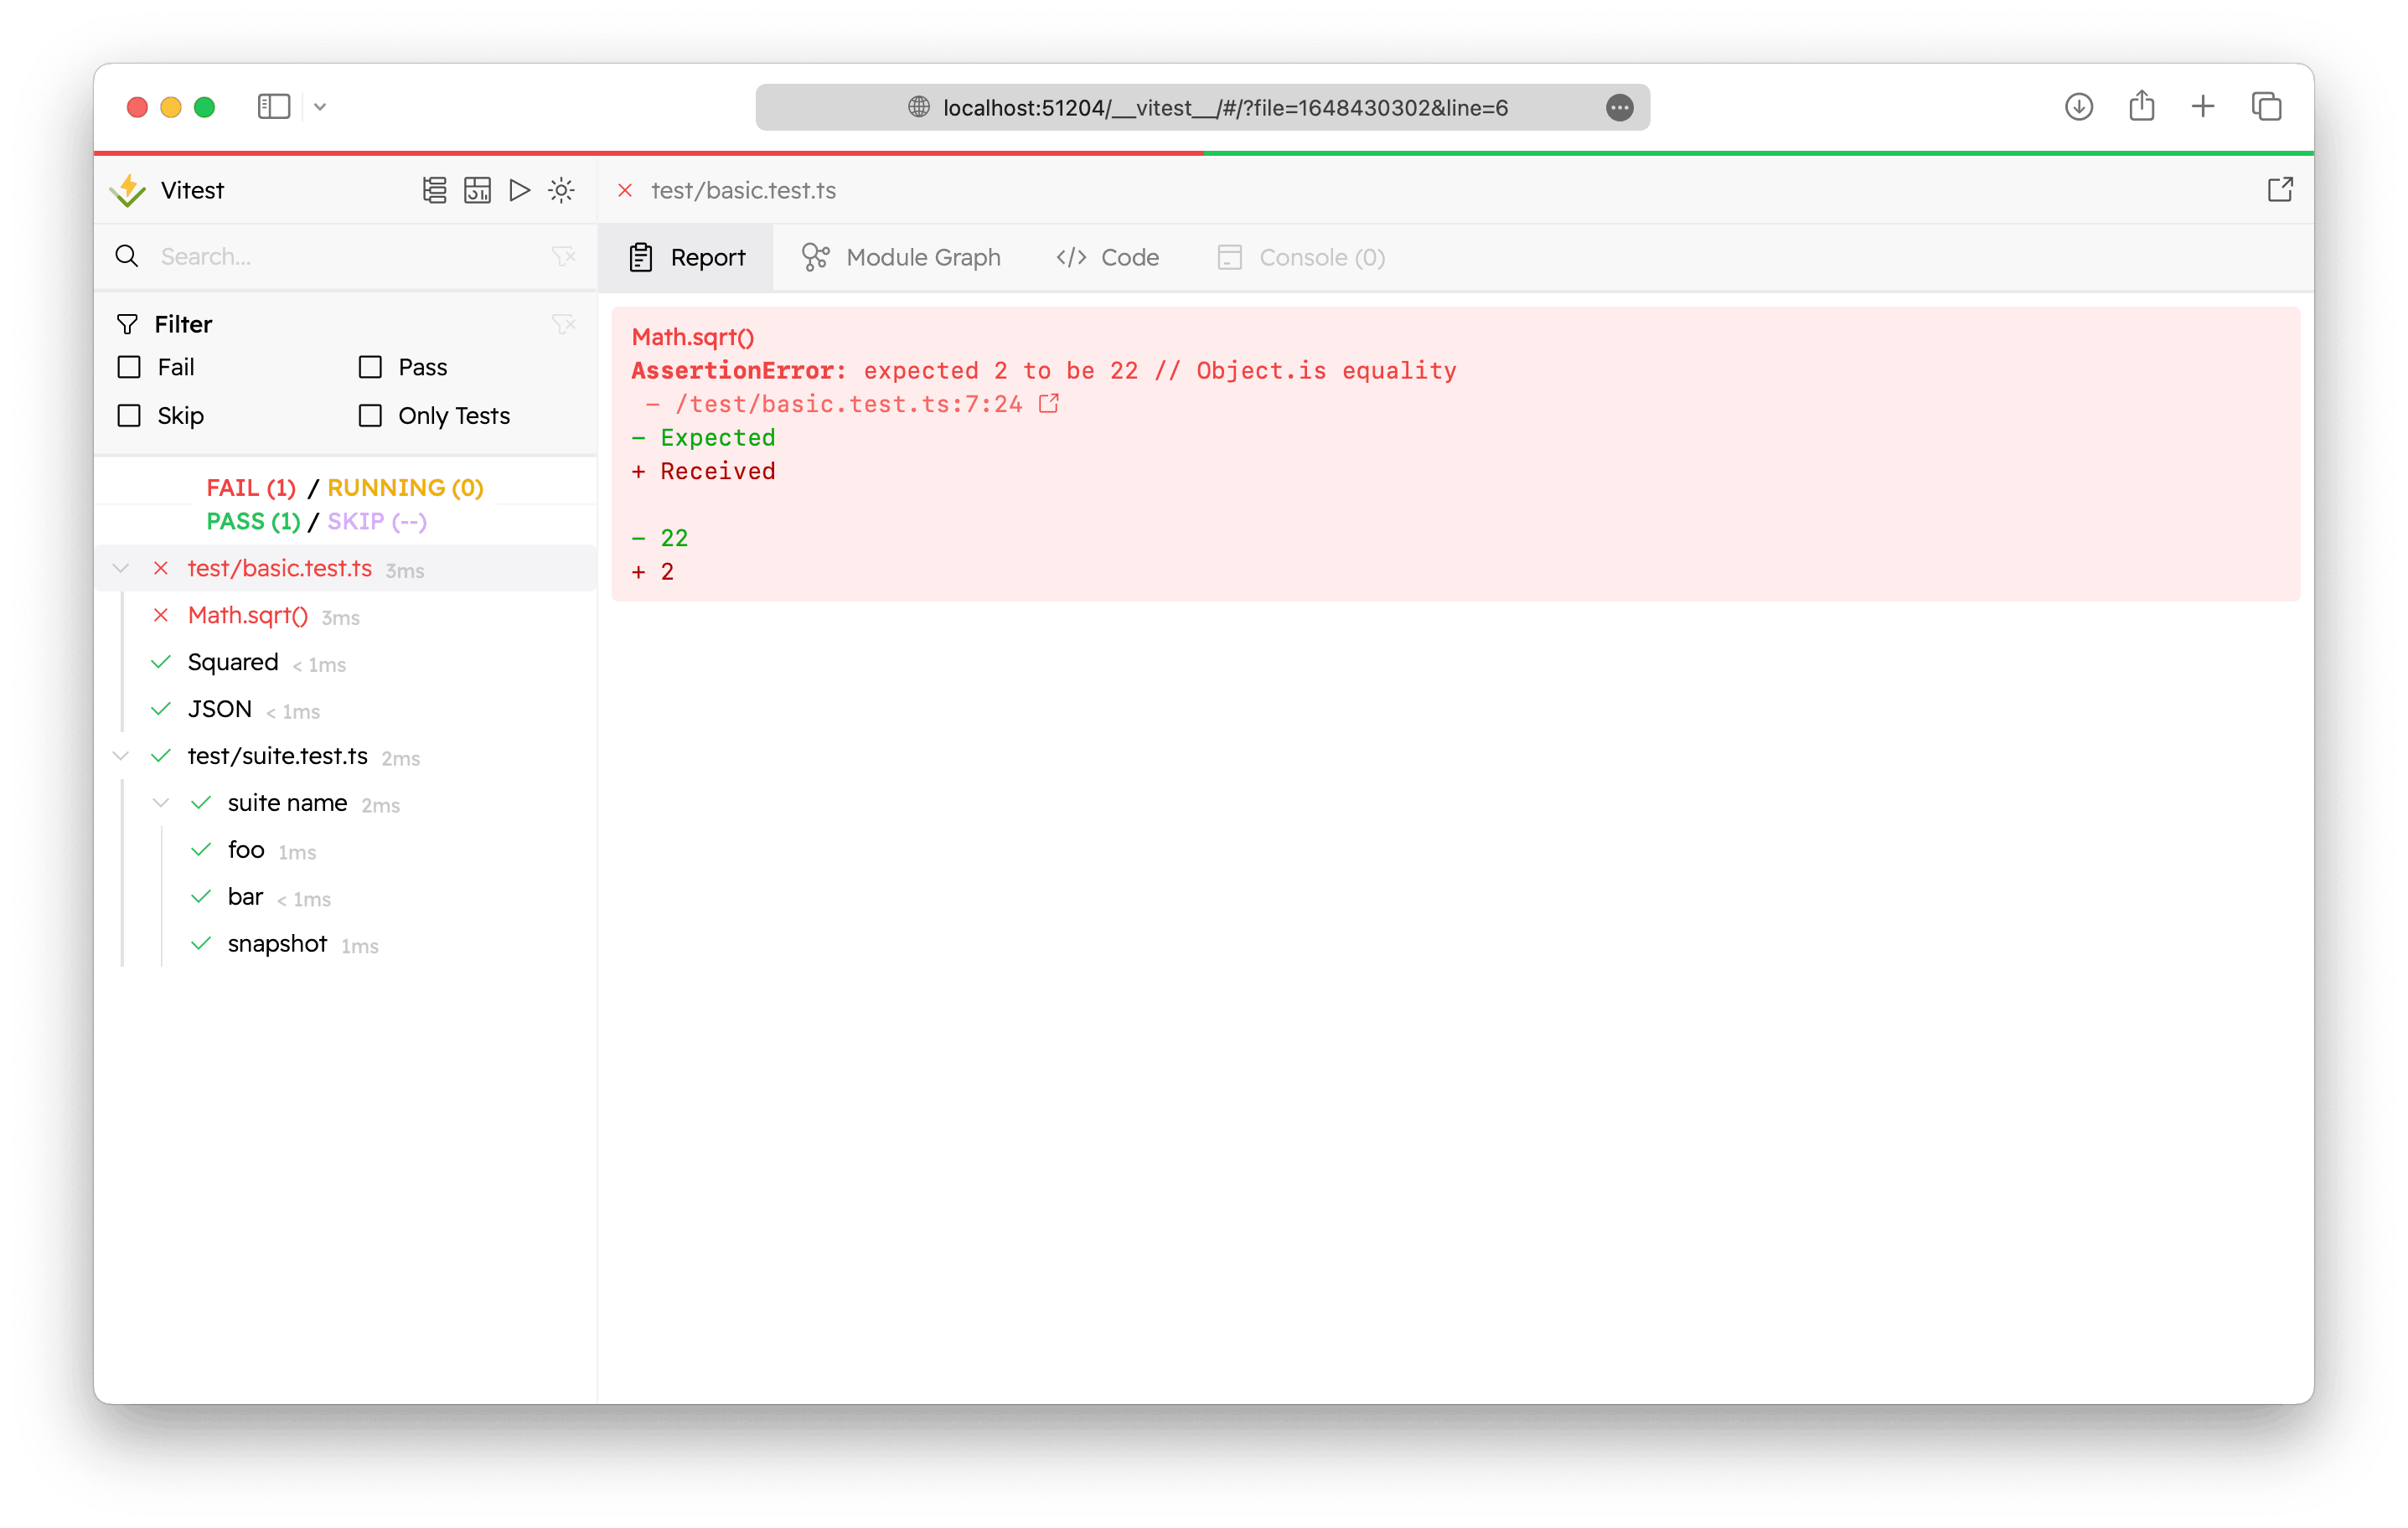
Live UI
The Live UI runs alongside Vitest's development server and requires watch mode, which is enabled by default. It stays connected to the running Vitest process, so results update as tests rerun. You can also rerun selected tests, update failed snapshots, and edit test files directly from the UI.
Start it by passing the --ui flag:
vitest --uiThen you can visit the Vitest UI at http://localhost:51204/__vitest__/
TIP
Vitest UI access is protected. If the direct URL shows an error, open the URL with a token printed by Vitest in the terminal, for example http://localhost:51204/__vitest__/?token=....
HTML Reporter
The HTML reporter writes test results to a static version of Vitest UI. The result views remain navigable, but the report is read-only and cannot rerun tests, update snapshots, or edit test files. It is useful for run mode, CI, and automated workflows where results are reviewed later.
Use the html reporter from the command line or in your Vitest configuration:
import { defineConfig } from 'vitest/config'

export default defineConfig({
  test: {
    reporters: ['html'],
  },
})vitest run --reporter=htmlKeep terminal output
Configuring the HTML reporter replaces the default terminal reporter. To keep terminal output, include Vitest's default reporters.
import { configDefaults, defineConfig } from 'vitest/config'

export default defineConfig({
  test: {
    reporters: ['html', ...configDefaults.reporters],
  },
})
Preview Locally
By default, the report entry is written to .vitest/index.html. You can configure the artifact directory with the HTML reporter's outputDir option.
To preview the default output, use the vite preview command:
npx vite preview --outDir .vitestOpen the URL printed by Vite in your browser. Alternatively, VS Code's Integrated Browser can open .vitest/index.html directly without a preview server.
Share as a Single File
Set singleFile to generate a self-contained HTML report:
export default defineConfig({
  test: {
    reporters: [
      ['html', { singleFile: true }],
    ],
  },
})
When singleFile is enabled, Vitest inlines the UI assets, metadata, and test attachments into a single self-contained index.html. This makes the report easy to share, upload, or download as one artifact instead of preserving the whole output directory.
Because everything is inlined, you can open <outputDir>/index.html directly in a browser with a file:// URL. No preview server is required.
WARNING
singleFile has two caveats:
- The file can grow very large because everything is embedded inline. It can be slow to open, memory-hungry, or exceed the size limits of artifact viewers and static hosts.
- Coverage HTML reports are not inlined yet and remain as separate files.
Prefer the default multi-file report when the suite has many or large attachments, or when you need coverage included in the bundle.
View Reports from CI
To view the HTML report from CI, for example in GitHub Actions, upload the output directory as an artifact:
- uses: actions/upload-artifact@v7
  id: upload-report
  with:
    name: vitest-report
    path: .vitest/

- name: Link HTML report
  run: echo "::notice title=Vitest HTML report::$REPORT_URL"
  env:
    REPORT_URL: https://viewer.vitest.dev/?url=${{ steps.upload-report.outputs.artifact-url }}
This adds the report link as a notice annotation on the workflow run. Click it to open the report in Vitest Viewer directly in the browser. You can also download the artifact manually and extract it, then run vite preview locally as above.
When you use singleFile: true, you can upload the report as a single file and view it directly from GitHub artifacts with the archive: false option:
- uses: actions/upload-artifact@v7
  id: upload-report
  with:
    path: .vitest/index.html
    archive: false

- name: Link HTML report
  run: echo "::notice title=Vitest HTML report::$REPORT_URL"
  env:
    REPORT_URL: ${{ steps.upload-report.outputs.artifact-url }}
Coverage
Vitest UI displays coverage results in both the Live UI and HTML reports. See Vitest UI Coverage for setup and usage.
Trace View
Vitest UI replays recorded browser interactions when browser.traceView is enabled. The Live UI streams trace entries as tests run, while HTML reports preserve recorded traces for later review.
Module Graph
Module Graph's tab displays the module graph of the selected test file.
INFO
All of the provided images use Zammad repository as an example.
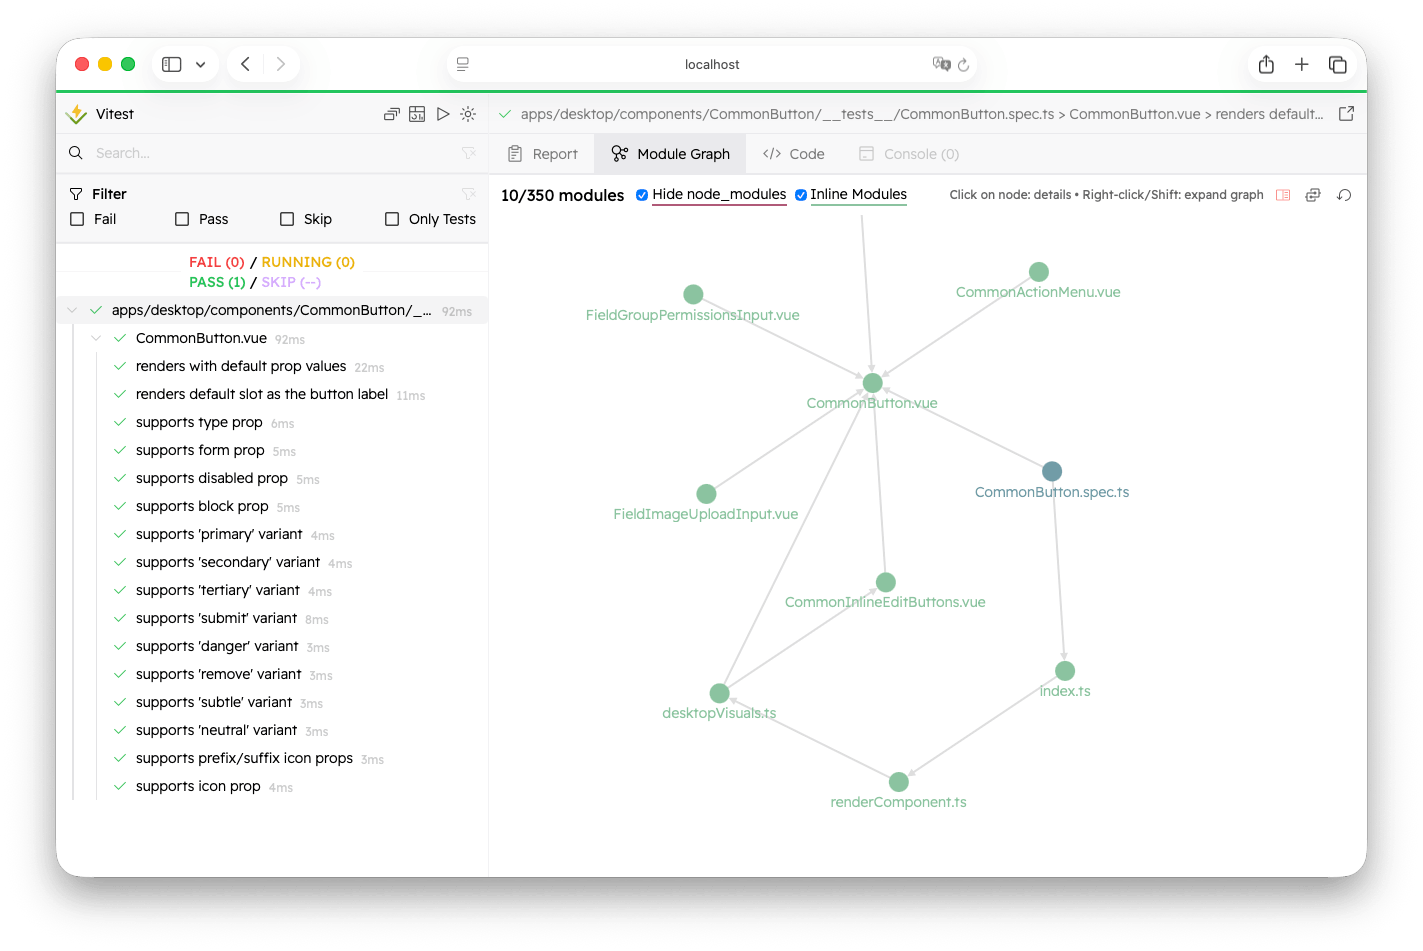
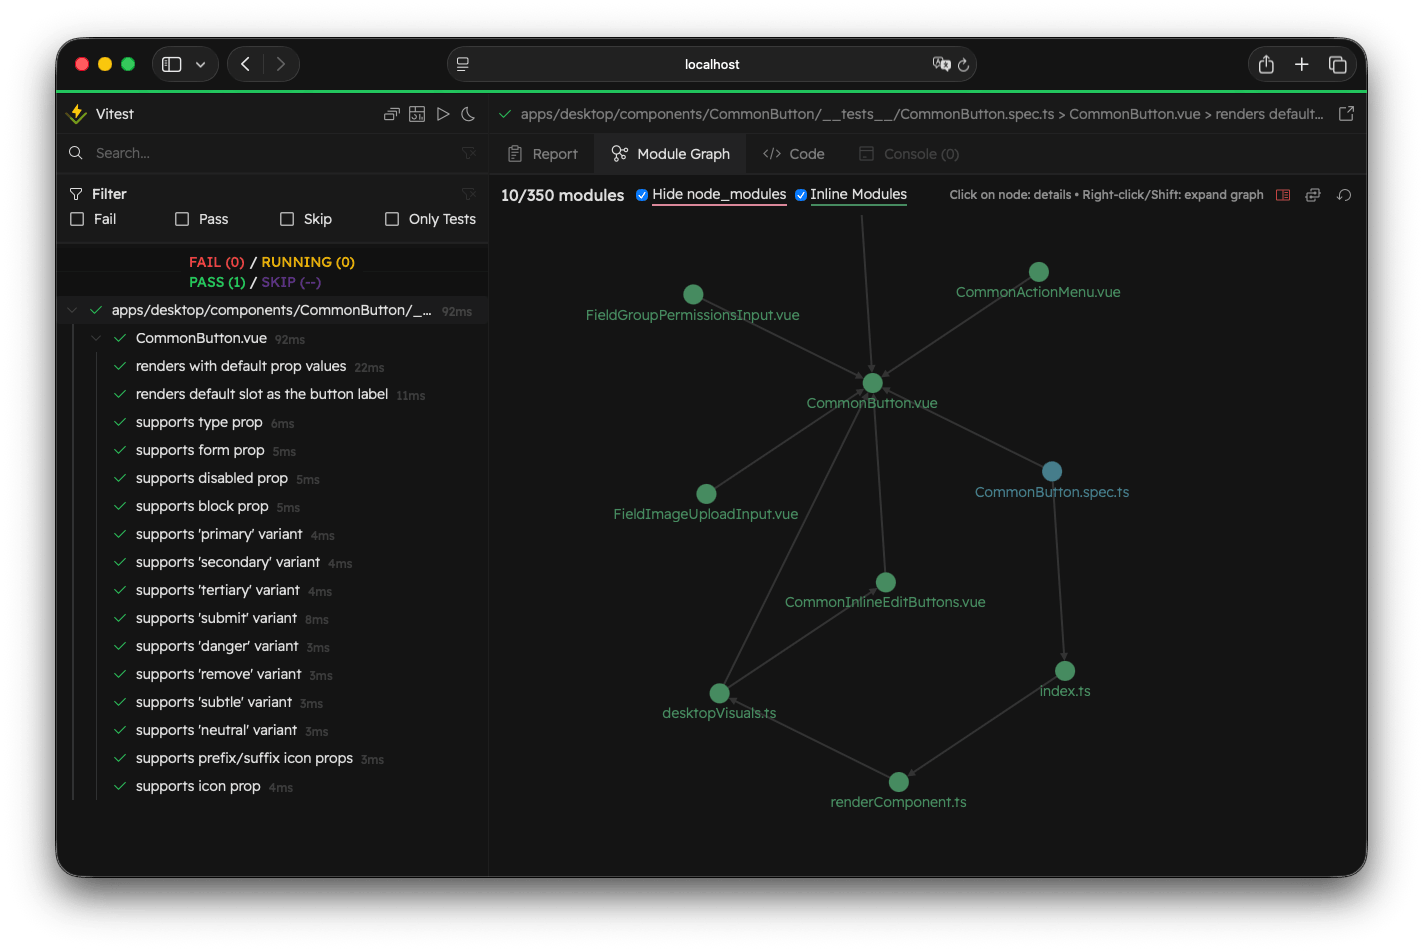
If there are more than 50 modules, the module graph displays only the first two levels of the graph to reduce the visual clutter. You can always click on "Show Full Graph" icon to preview the full graph.
WARNING
Note that if your graph is too big, it may take some time before the node positions are stabilized.
You can always restore the entry module graph by clicking on "Reset". To expand the module graph, right-click or hold Shift while clicking the node that interests you. It will display all nodes related to the selected one.
By default, Vitest doesn't show the modules from node_modules. Usually, these modules are externalized. You can enable them by deselecting "Hide node_modules".
Module Info
By left-clicking on the module node, you open the Module Info view.
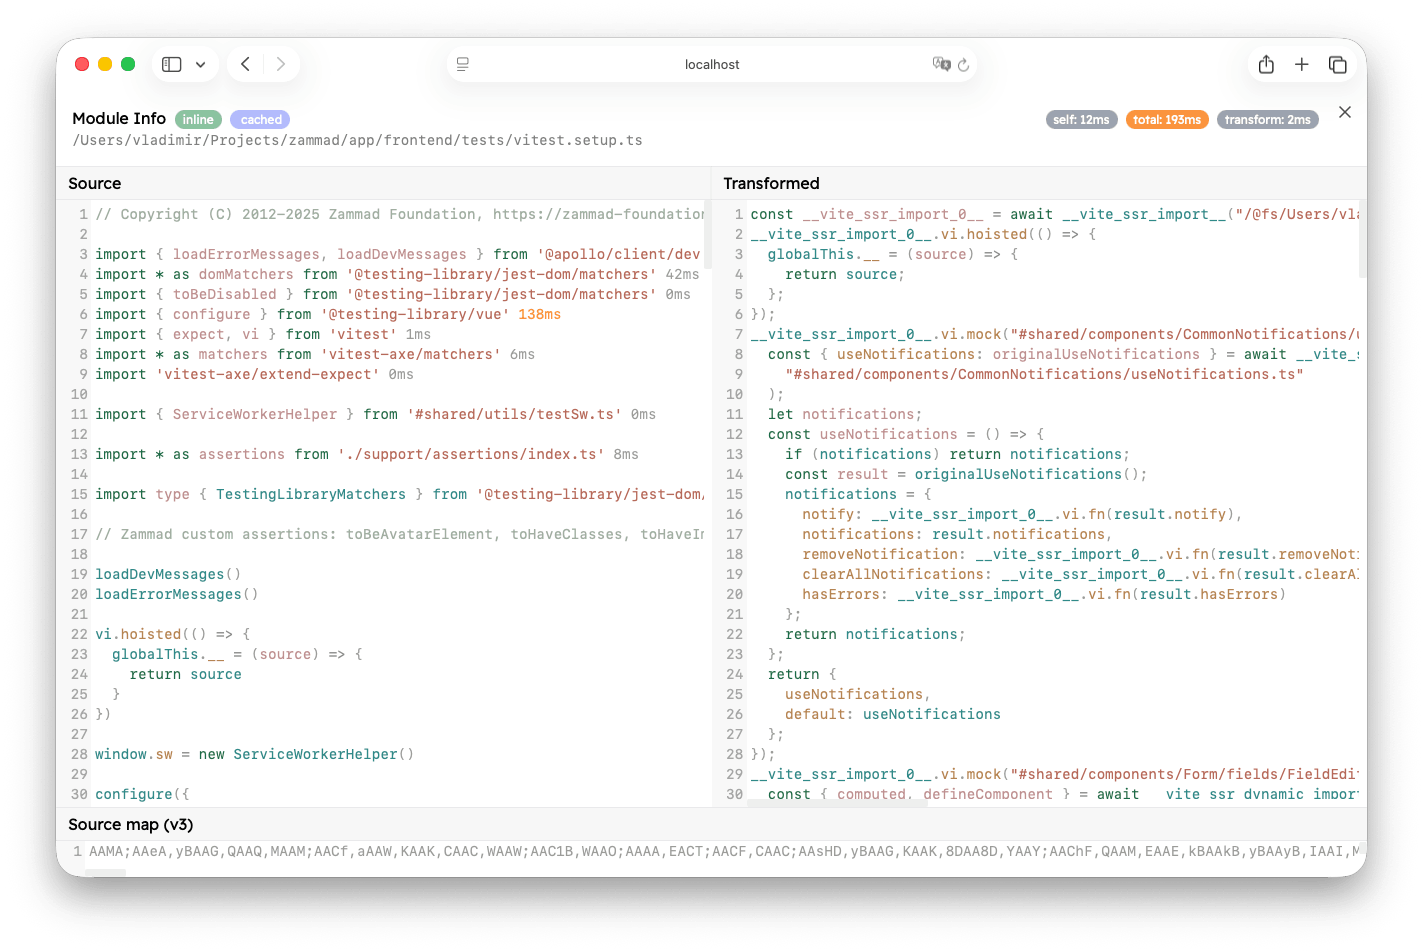
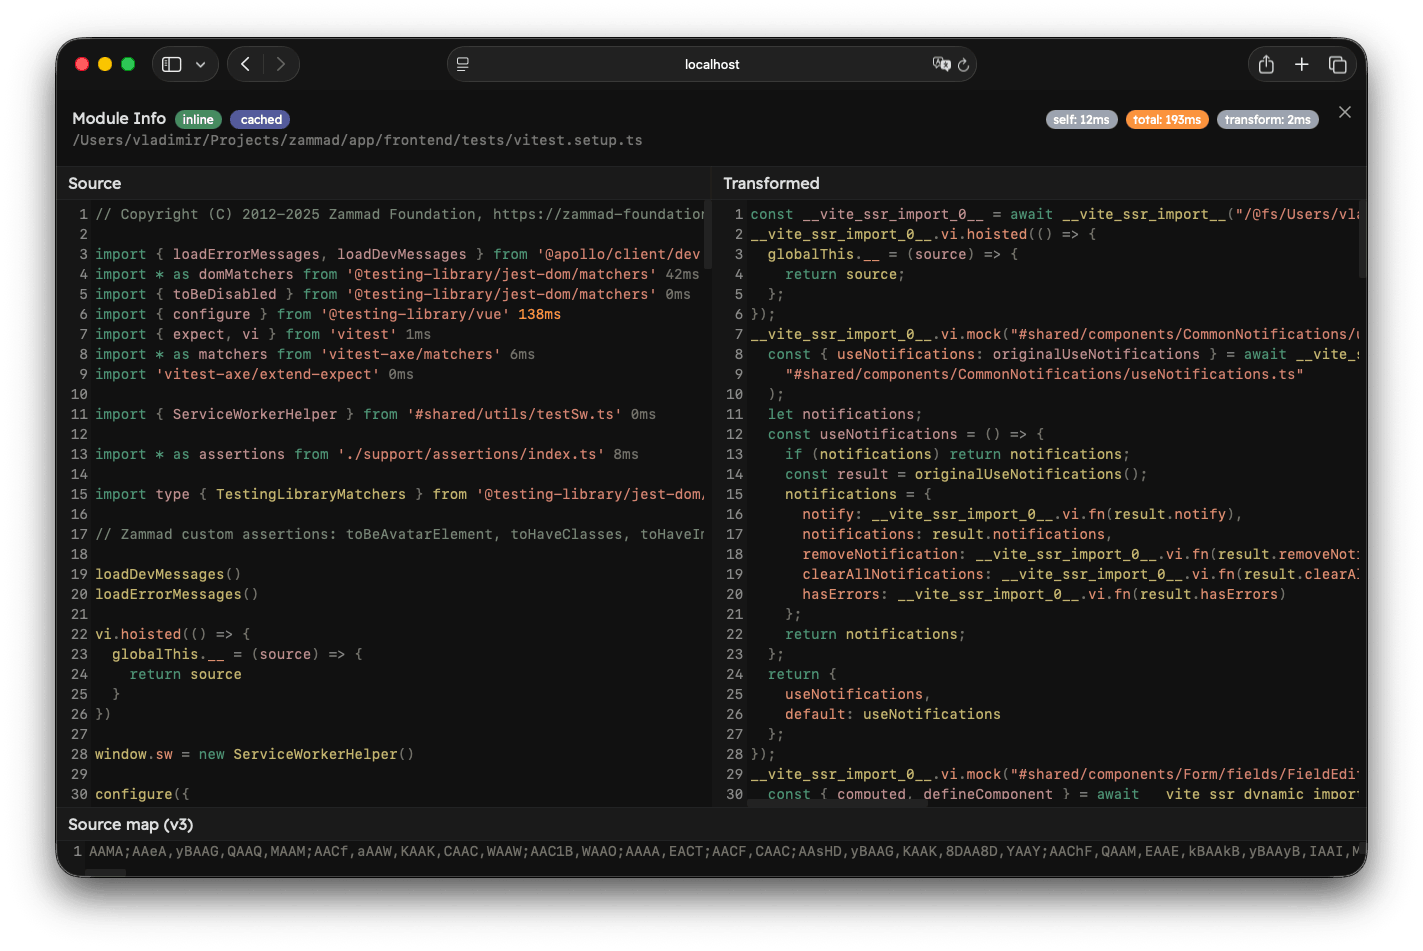
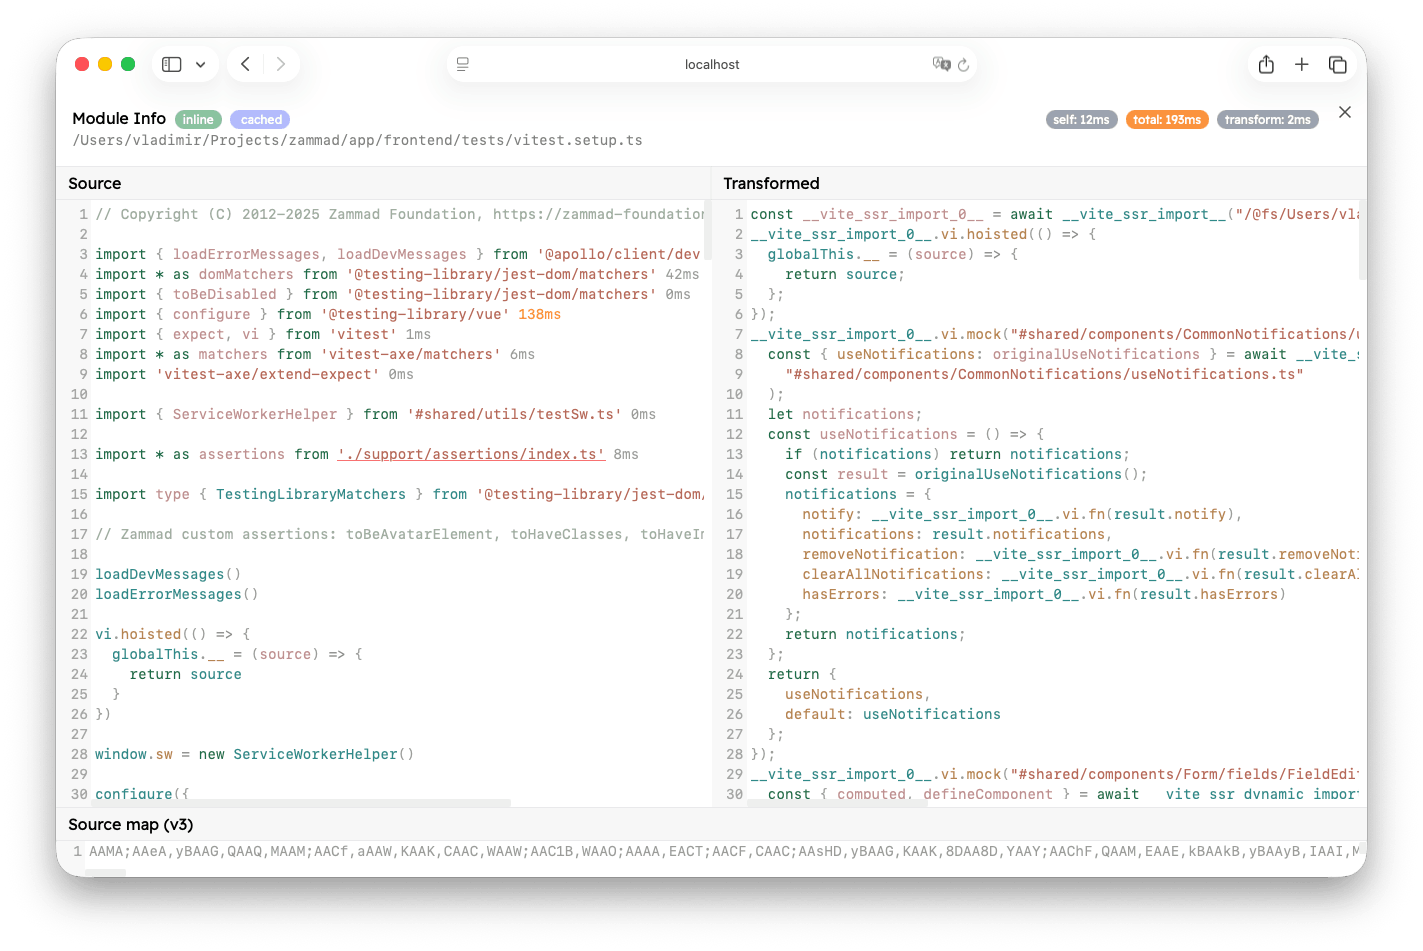
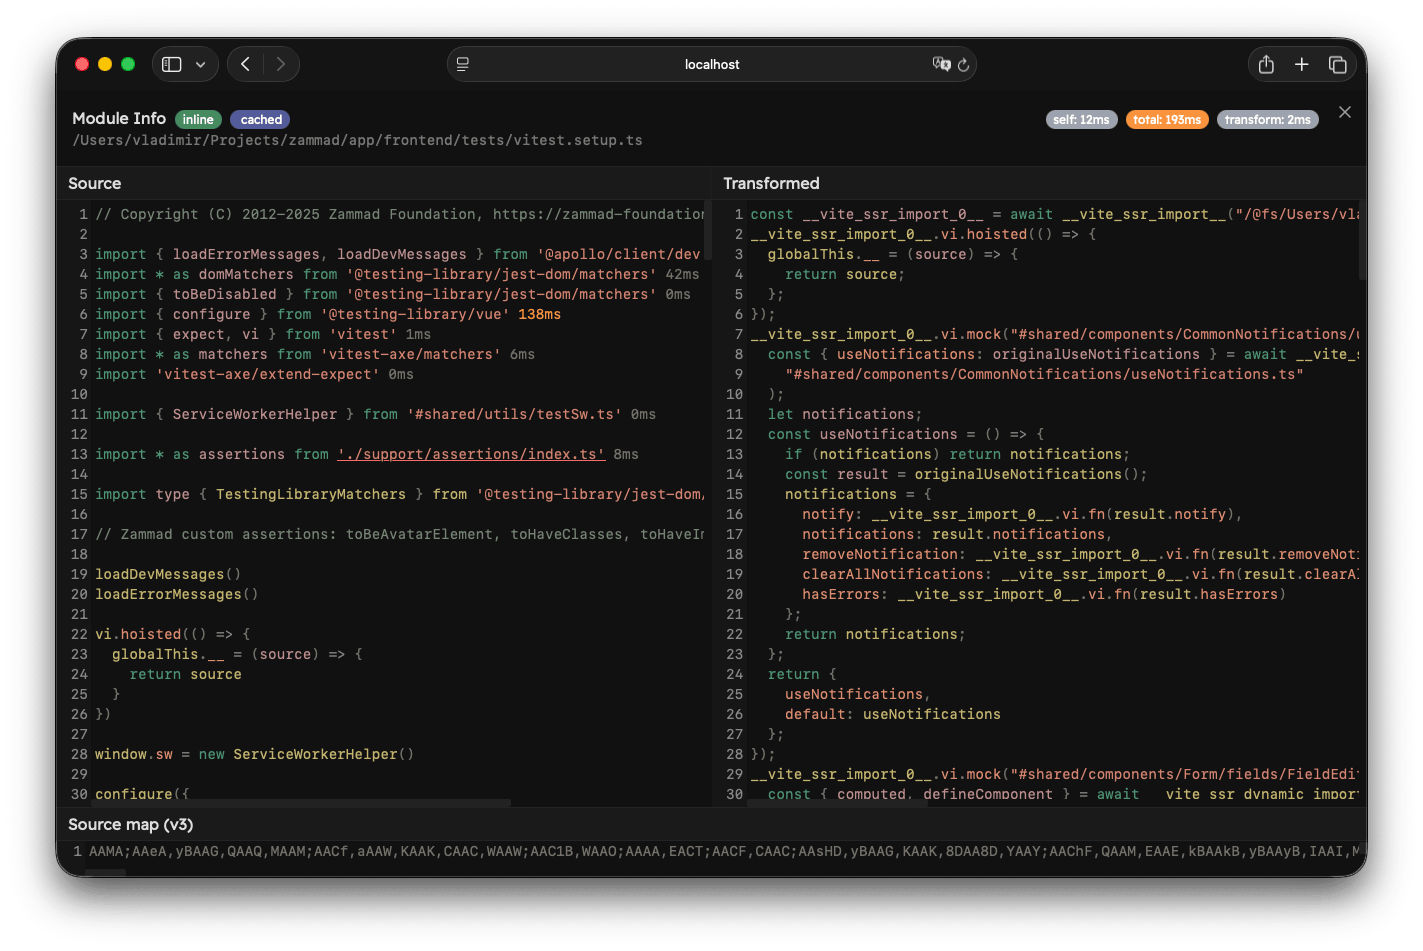
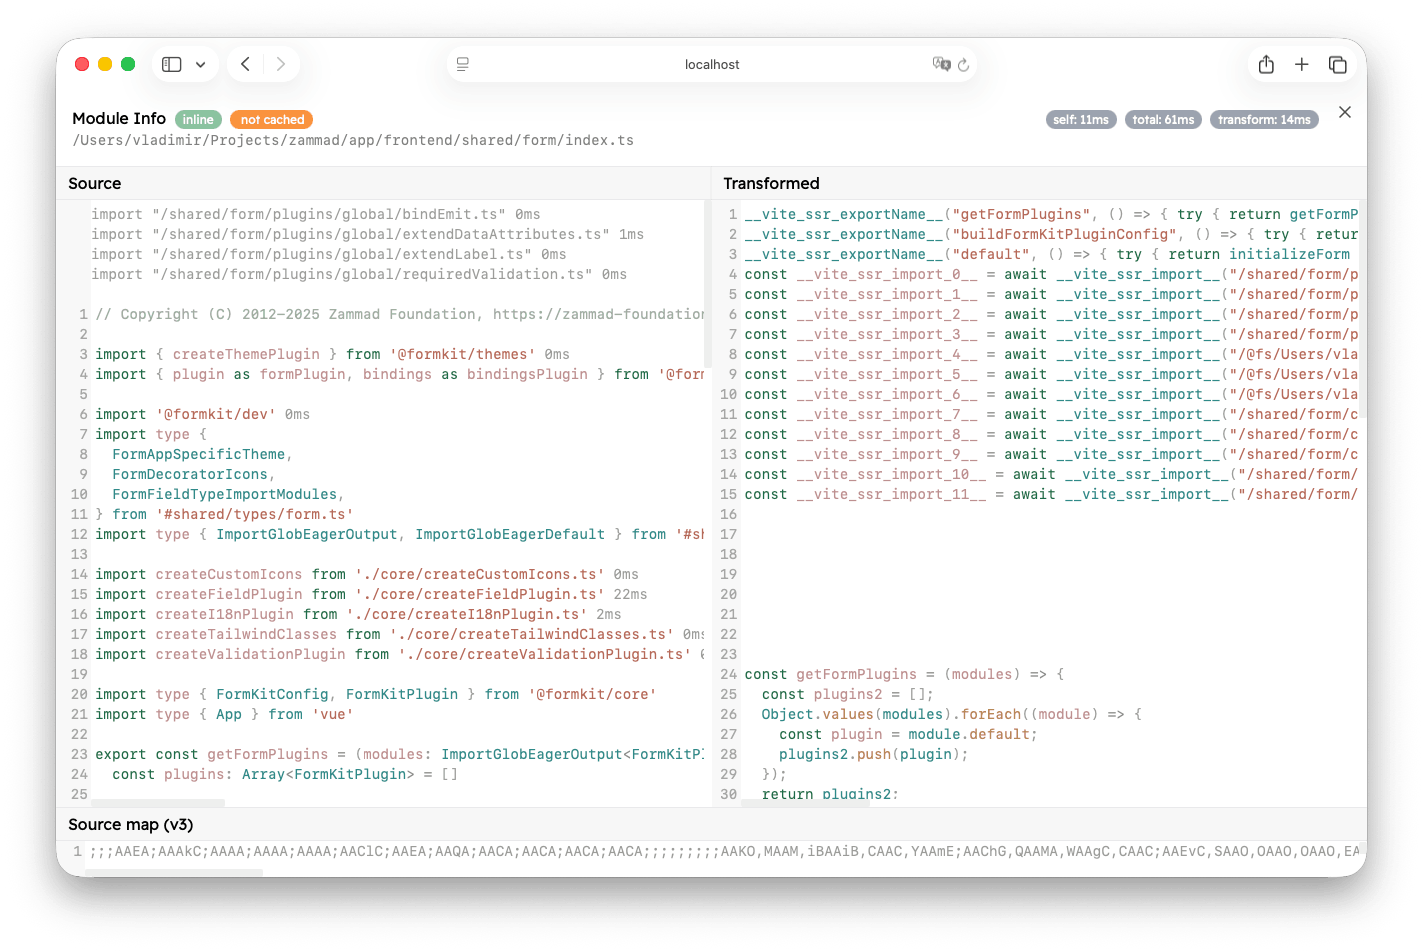
This view is separated into two parts. The top part shows the full module ID and some diagnostics about the module. If fsModuleCache is enabled, there will be a "cached" or "not cached" badge. On the right you can see time diagnostics:
- Self Time: the time it took to import the module, excluding static imports.
- Total Time: the time it took to import the module, including static imports. Note that this does not include
transformtime of the current module. - Transform: the time it took to transform the module.
If you opened this view by clicking on an import, you will also see a "Back" button at the start that will take you to the previous module.
The bottom part depends on the module type. If the module is external, you will only see the source code of that file. You will not be able to traverse the module graph any further, and you won't see how long it took to import static imports.
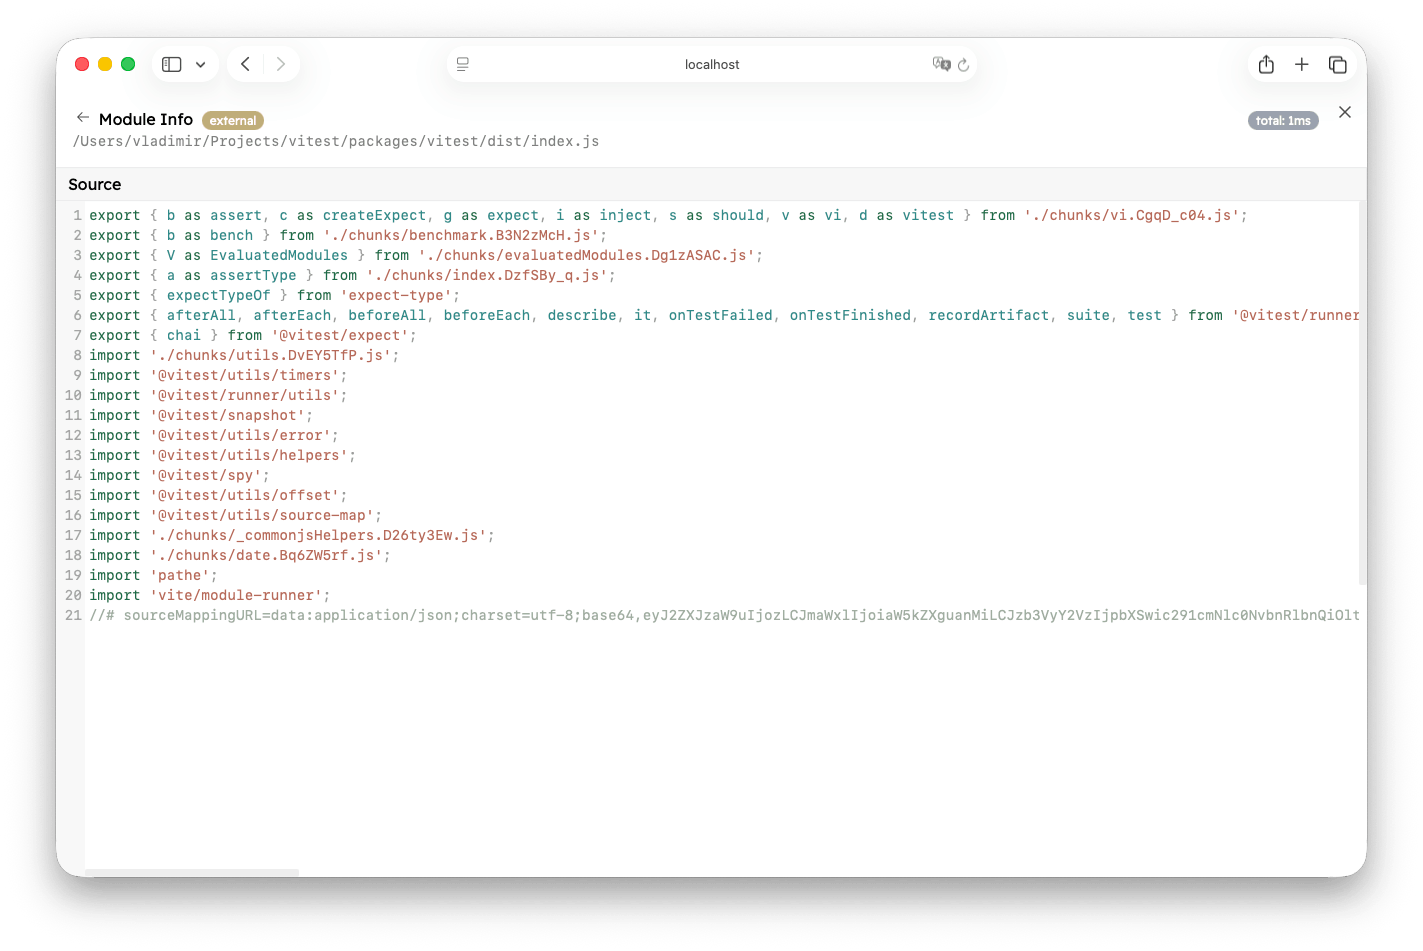
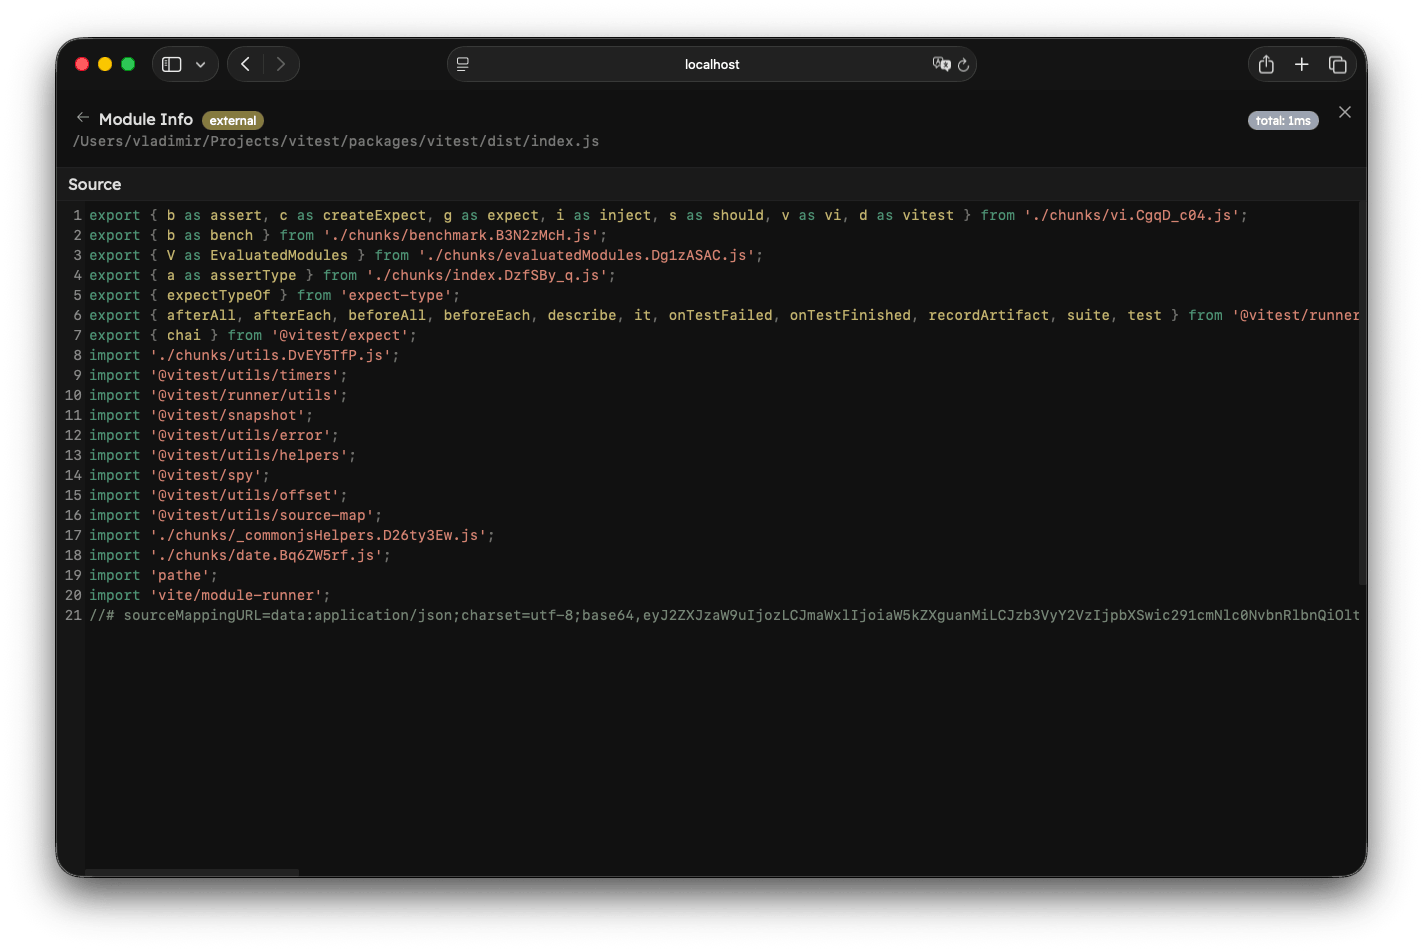
If the module was inlined, you will see three more windows:
- Source: unchanged source code of the module
- Transformed: the transformed code that Vitest executes using Vite's module runner
- Source Map (v3): source map mappings
All static imports in the "Source" window show a total time it took to evaluate them by the current module. If the import was already evaluated in the module graph, it will show 0ms because it is cached by that point.
If the module took longer than the danger threshold (default: 500ms) to load, the time will be displayed in red. If the module took longer than the warn threshold (default: 100ms), the time will be displayed in orange.
You can click on an import source to jump into that module and traverse the graph further (note ./support/assertions/index.ts below).
WARNING
Note that type-only imports are not executed at runtime and do not display a total duration. They also cannot be opened.
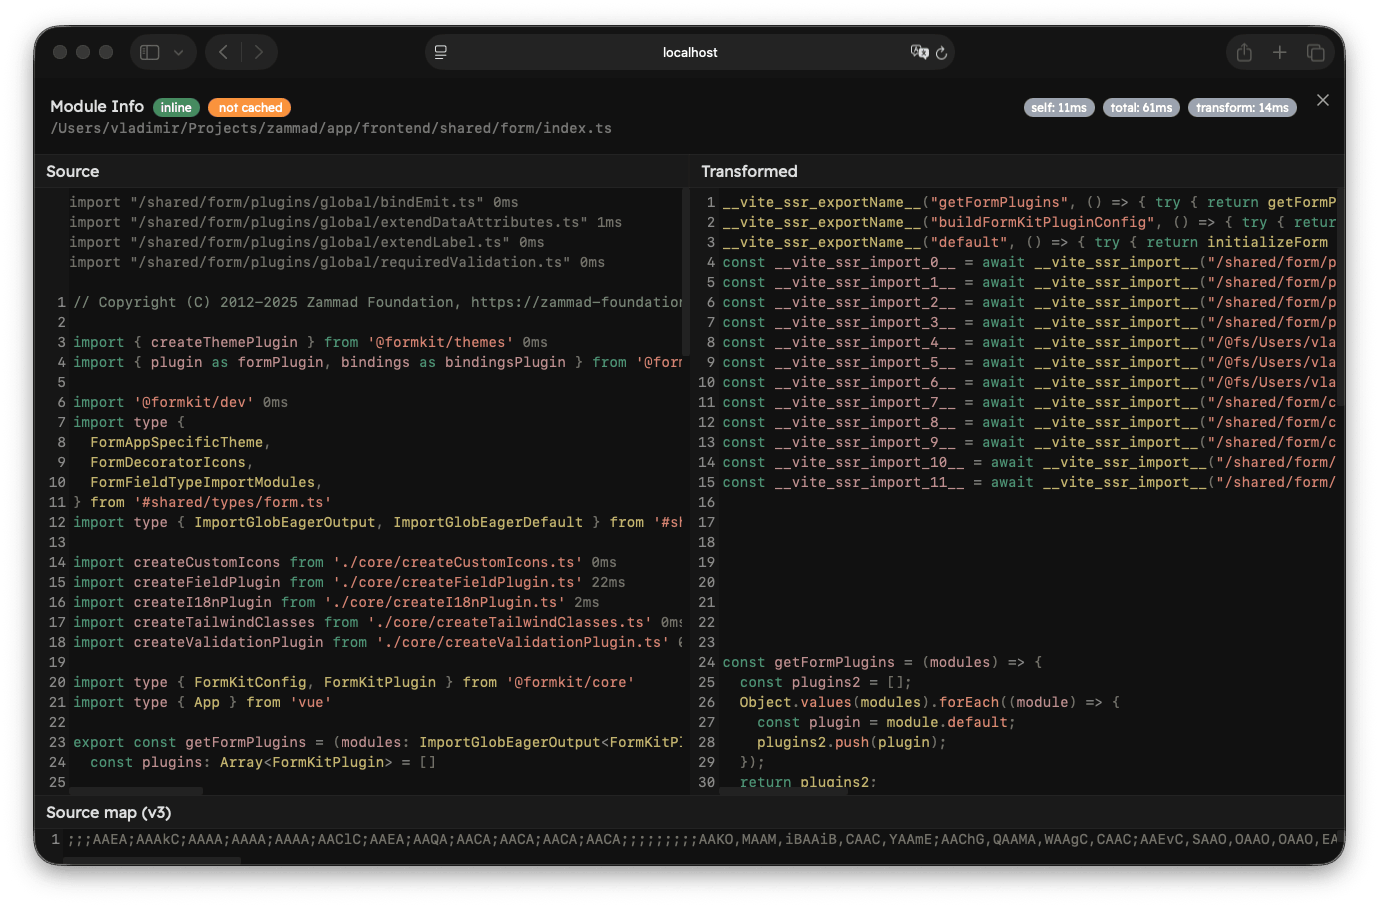
If another plugin injects a module import during transformation, those imports will be displayed at the start of the module in gray colour (for example, modules injected by import.meta.glob). They also show the total time and can be traversed further.
TIP
If you are developing a custom integration on top of Vitest, you can use vitest.experimental_getSourceModuleDiagnostic to retrieve this information.
Import Breakdown
FEEDBACK
Please, leave feedback regarding this feature in a GitHub Discussion.
The Module Graph tab also provides an Import Breakdown with a list of modules that take the longest time to load (top 10 by default), sorted by Total Time.
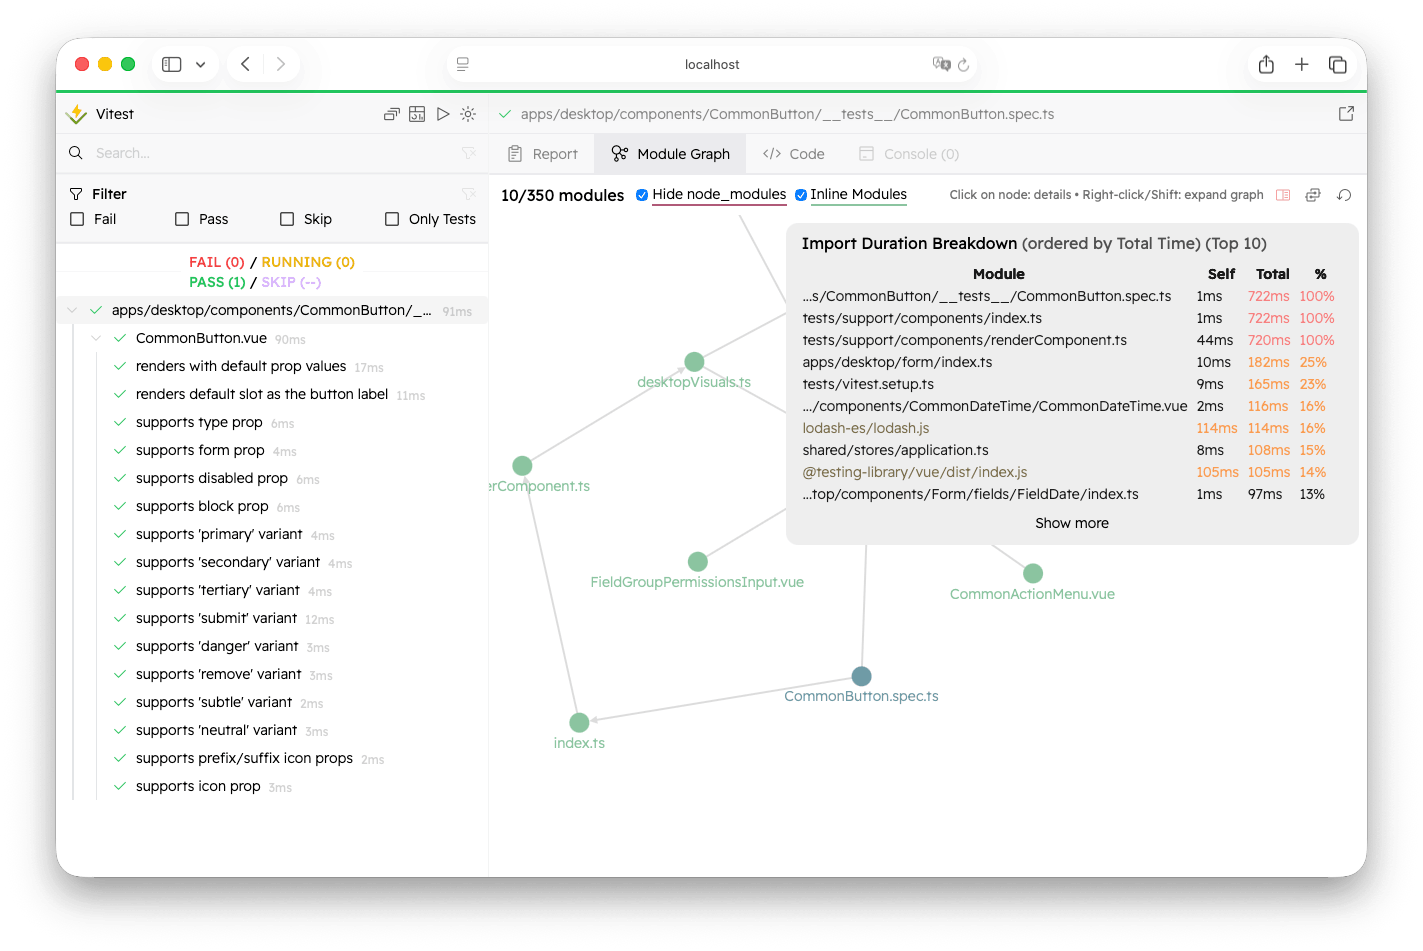
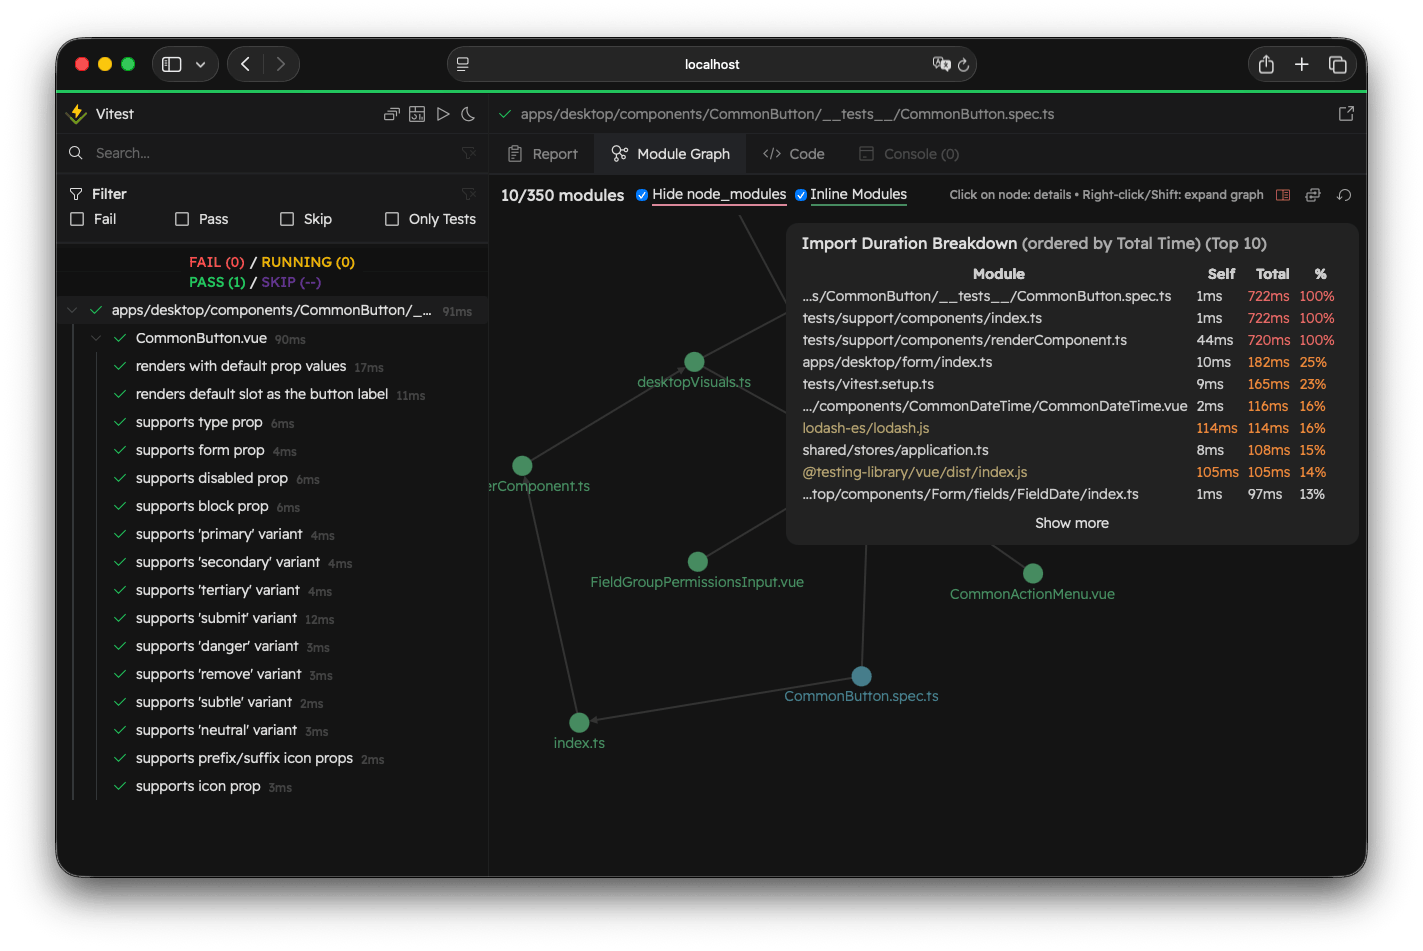
You can click on the module to see the Module Info. If the module is external, it will have the yellow color (the same color in the module graph).
The breakdown shows a list of modules with self time, total time, and a percentage relative to the time it took to load the whole test file.
The "Show Import Breakdown" icon will have a red color if there is at least one file that took longer than the danger threshold (default: 500ms) to load, and it will be orange if there is at least one file that took longer than the warn threshold (default: 100ms).
You can use experimental.importDurations.limit to control the number of imports displayed.